
I got on the scale yesterday morning, and all I could say was, “ugh.” Feasting on Chinese food the night before had its consequences. “What is it about Wednesdays?” I asked myself. It seemed like I’d seen a few Wednesdays like this.
But had I? This is how urban legends are born. You start to get a feeling that something is true: “I tend to gain weight on Wednesdays” or “More babies are born when the moon is full.” Then every time you see something that corroborates the impression, the more sure you get. Meanwhile, you don’t notice the unremarkable Wednesdays when weight follows its usual pattern.
However, having measured and recorded my weight consistently since last June (well, mostly consistently – more on that in a bit), I had the data to actually measure whether Wednesdays were Big Wednesdays or not. It took a little fiddling (I am not the spreadsheet-jockey that many of my coworkers are, and Apple’s spreadsheet, Numbers, lacks an obvious function that would have made this much easier), but I ended up with this graph:
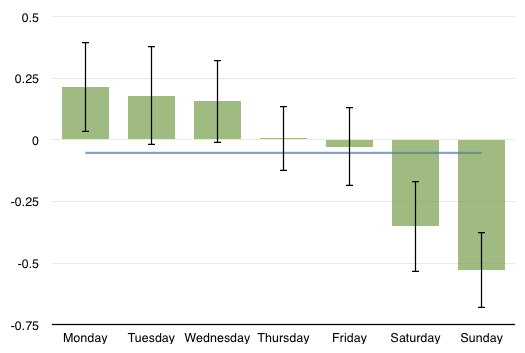
My weight change by day of week. (For me, negative is good.) The horizontal blue line is the average for all days.
It turns out Wednesdays are net-gain days, but not as bad as Mondays or Tuesdays. It’s odd that despite my having lost 13 pounds over that time, the first half of the work week still shows a net increase in plumpness. Notice also the shorter error bars Wednesday and Thursday; for whatever reason (or for no reason at all) the numbers are in a closer range on those days.
As you look at the graph, keep in mind that I weigh myself first thing in the morning, so the weight change is a reflection of the choices I made the day before. So while I show the most weight gain on Mondays, it’s actually what I do on Sunday that leads to it.
There’s also a subtle measurement bias that makes the weekend look better at the expense of Monday. I sleep in on the weekends, so my body processes a measurable amount of extra water before I climb on the scale. So, Saturdays may not be as good as they seem in this graph, and Mondays may not be as bad. Even so, it’s hard to ignore the trend that shows up here, and it makes me wonder a couple of things.
First, I’m not aware of anything I do substantially differently on Thursday than I do on Monday, yet the outcome seems quite different. This suggests to me that the lag time between decision and consequence is often more than twenty-four hours. That bulge early in the week may be the previous weekend catching up to me. Or it may not; there’s no way to tell from this data. I may try to research this further out there on the Internet.
Second, is this information actionable? Can I look at this little graph and make better life choices on Mondays? Probably I can, but honestly, I probably won’t. This graph will likely remain for me a mildly-interesting little factoid, and as long as my week-on-week numbers stay in the green, I’ll not worry so much.

If this were actual science, there would be error bars on the above measurements. So far, my spreadsheet has thwarted my attempts to get the standard deviation of the above averages. Seems like that should be straightforward.
I have now conquered the error bar issue. It was non-trivial in Numbers, and would have been much easier in Excel. But I’ve come to like the ‘cloudiness’ of Numbers.